
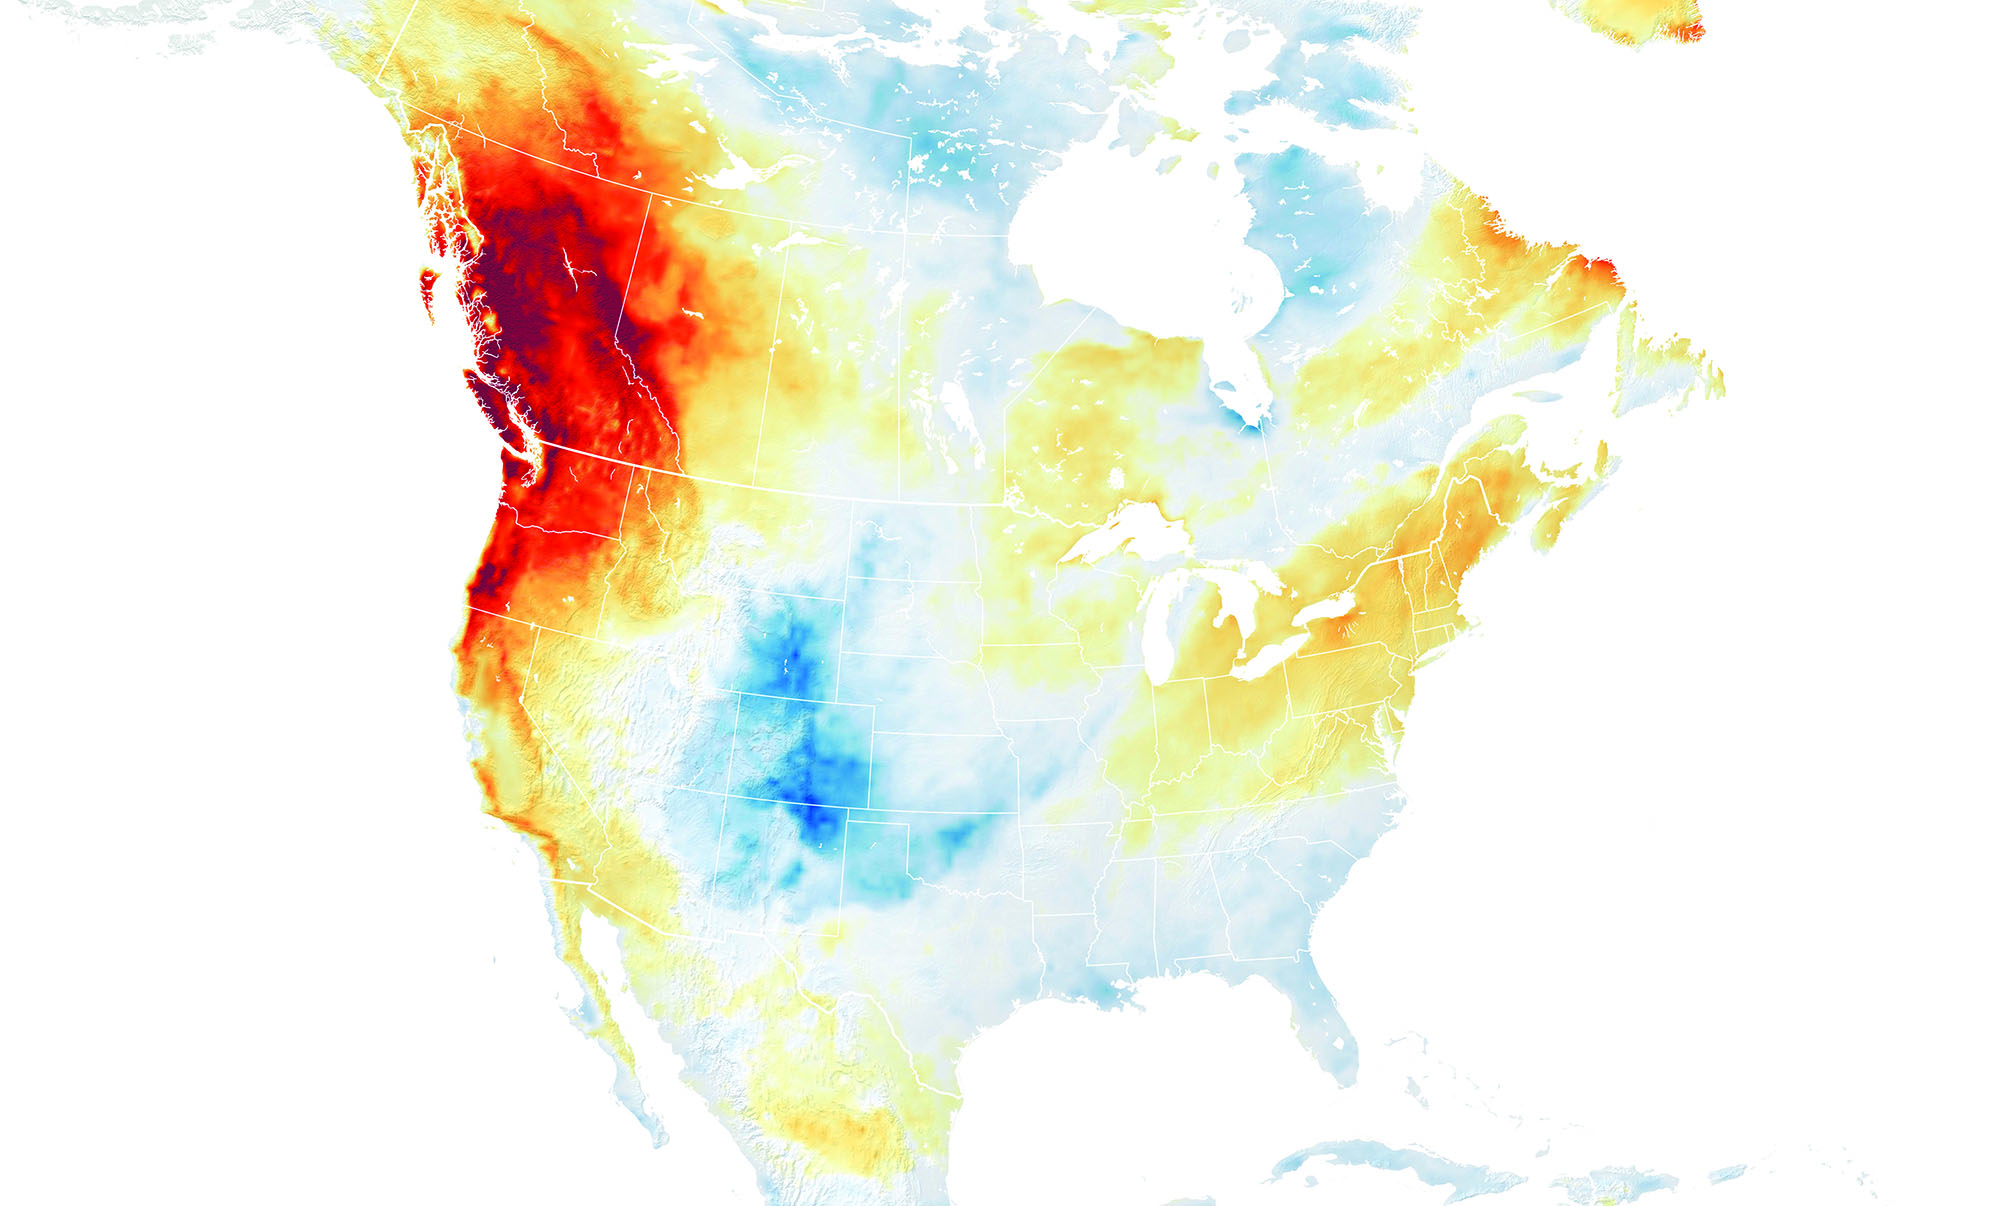
This map shows air-temperature anomalies on June 28, 2021, as a heat wave gripped the Pacific Northwest. UChicago scientists have identified the previously unknown cause of the deadly weather event. (NASA Earth Observatory)
UChicago scientists solve a heat wave mystery.
Last summer a deadly heat wave struck the Pacific Northwest, causing temperatures to soar more than 30 degrees Fahrenheit above seasonal averages and killing more than a thousand people. Streetcar cables melted in Portland, Oregon; pavement buckled across the region. Before it was over, a town in British Columbia tied Death Valley for the highest temperature ever recorded in North America: 121 degrees Fahrenheit.
The heat began on June 26, 2021, but the sweltering temperatures were set in motion weeks earlier. A new study from UChicago researchers has uncovered the sequence of meteorological events that precipitated the disaster, providing information that could further scientists’ understanding of heat formation on the North American continent—and shed light on the likelihood of such extreme events in the future. The paper by Emily Neal, SB’22; Clare S. Y. Huang, PhD’17; and Noboru Nakamura, professor of geophysical sciences, appeared in Geophysical Research Letters.
Neal, Huang, and Nakamura used meteorological data to re-create the conditions that preceded the heat wave. They found that in the week prior, a cyclone—a large spiral-shaped air mass rotating around a center of low pressure—formed over the Gulf of Alaska. As water vapor condensed into those spiral-shaped clouds, heat accumulated in the atmosphere.
As the cyclone moved slowly east, it triggered the formation of an anticyclone—a system that rotates slowly around a center of high pressure instead of low. Anticyclones are a type of “blocking” system—those that disrupt the normal movement of weather systems. The blocking anticyclone acted like a blanket, trapping heat in the region and creating a warm, stagnant column of air that made it difficult for surface heat to escape to the upper atmosphere as it normally does.
Blocking systems are well known for causing heat waves in the midlatitudes, explains Neal, the first author on the paper. “But this was an extraordinarily strong blocking event,” she says. “Our analysis showed that the warmth of the air column within the blocking system was in the top 0.01 percent of all events along the same latitude in the past half a century.”
The research offers a new perspective on the formation of North American heat waves. Most of the existing literature examines events on the European subcontinent, which has its own unique geography and meteorology that may not apply elsewhere.
For example, soil moisture is thought to be a major factor in European heat waves. “But we don’t think this was at play here,” Neal says. “Particularly in British Columbia, where much of this is taking place, it’s a very dry environment. So that means we may be looking at a different mechanism than what is in the common literature.”
The detective work is also the first real-world test for an analytical approach developed by Nakamura to fill gaps in our understanding of exactly what leads to large-scale weather and why. Typically, when scientists run climate simulations, they rely heavily on statistics to analyze the results. These computer models work fairly consistently for predicting average surface temperature or rainfall in the future. But “if you ask these models to predict the frequency and intensity of future extreme events, such as blocking anticyclones,” says Nakamura, “the answers tend to be all over the map.”
So to more accurately predict the likelihood and severity of future extreme events, scientists need new methods to better understand the connection between the dynamics and statistics of weather events. To that end, Nakamura and his group have spent the past decade working out the fluid dynamics and hydrology behind large-scale atmospheric events and creating models that explain how midlatitude weather systems work based on the physics and math of liquid and gas behavior. This analytical tool allowed them to identify the heat released by the cyclone as the main driver of the unusually strong Pacific Northwest heat wave, and may serve as a useful complement to purely statistical approaches.
Understanding extreme weather is especially important as we try to understand how climate change will affect the world. Scientists worry that we are approaching a tipping point in the alteration of Earth’s atmosphere, after which such events become much more likely. Other scientific studies have estimated that the magnitude of the Pacific Northwest heat wave was “virtually impossible” without climate change.
“There is increased urgency and interest in understanding the prospects for future heat waves,” says Nakamura. “Since the heating mechanism identified in this work involves condensation of water vapor into clouds, the intensity of atmospheric blocking and heat waves will likely increase as the warming climate allows more water vapor to be present in the atmosphere.”
Nakamura is eager to “begin using this framework to dissect data in a meaningful way, to actually see the important processes and driving forces behind events.”