

Kronwall, Datsyuk, and Kopecky. (Photography by Jeff Powers, CC BY-ND 2.0) (Graphic courtesy Estimating Player Contribution in Hockey with Regularized Logistic Regression; adapted by Joy Olivia Miller)
Chicago Booth statisticians do the math on the NHL's overpaid or undervalued players.
Bringing a Moneyball approach to hockey, Chicago Booth statisticians Robert Gramacy and Matt Taddy, working with Wharton’s Shane Jensen, analyzed National Hockey League player performance in a January working paper. Using statistics to strip away “noisy” data and isolate players’ individual contributions to their teams’ goal scoring from 2007 to 2011, they identified stars who aren’t playing up to their salaries and others with undervalued skills.
Most NHL players, the researchers found, do not stand out measurably from their teams’ average performances. In the chart above, the dots indicate the researchers’ calculations for individual contribution to goals, and tails link to more standard performance numbers, before team effects are taken into account. For instance, even Pittsburgh Penguins captain Sidney Crosby, widely considered the league’s best player, demonstrates a contribution to goal scoring that, while still high, drops after accounting for the strength of his team. The same is true of the Chicago Blackhawks’ forward Jonathan Toews and the Boston Bruins’ defenseman Zdeno Chara. Goaltender Dwayne Roloson’s stats seem to indicate a poor performance in the NHL, but the researchers’ metric showed him to be one of the strongest players, who shines despite his team.
By far, though, the league’s best player, according to the researchers, was the Detroit Red Wings’ Pavel Datsyuk, whose contribution coefficient remained steadily high even after his team was taken into account. The researchers recommend giving Datsyuk a raise.
Players’ effects on team scoring; green indicates stronger influence than standard performance numbers suggest; red indicates weaker.
[[{"type":"media","view_mode":"media_original","fid":"710","attributes":{"alt":"","class":"media-image","height":"1092","typeof":"foaf:Image","width":"460"}}]]
Names in red and green refer to players mentioned in the text.
Infographic
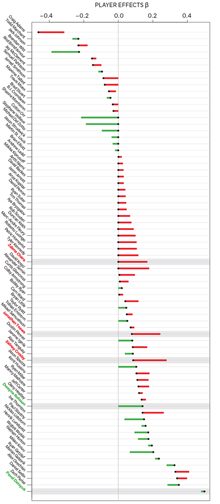
Players’ effects on team scoring, 2007–11; green indicates stronger influence than standard performance numbers suggest; red indicates weaker.