
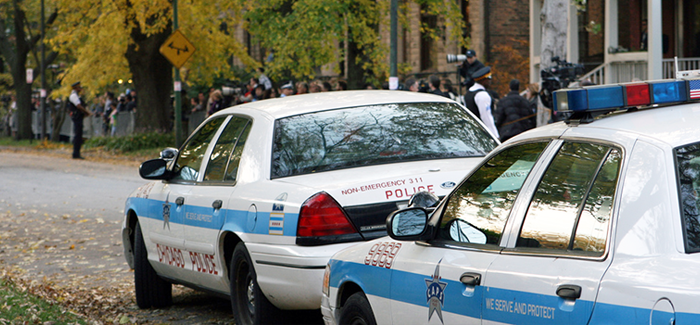
Chicago police in Hyde Park. (Photography by Quinn Dombrowski, AB’06, AM’06/CC BY-SA 2.0) (Graphic courtesy Daniel Hertz; adapted by Joy Olivia Miller)
A decline in the murder rate has been uneven in Chicago, increasing the gap between different parts of the city.
Chicago, says Harris School student Daniel Hertz, is neither the nation’s murder capital nor “Chiraq,” the nickname given to it in a recent HBO documentary. For his own interest, Hertz analyzed the Chicago Police Department’s data on homicides and reported the results in an August 5 post on his blog, City Notes, that went viral. The city’s overall murder rate, he found, dropped by nearly half between the early 1990s and the late 2000s, from 30 deaths per 100,000 citizens to 17. “For a couple of years, we had the highest number of murders” in the country, Hertz says. But even during the peak years of the early 1990s, Chicago was “nowhere close to having the highest murder rate.” The declines were substantial on the North Side, while the South and West Sides saw less change. The eight safest police districts—downtown and seven districts north of it—have an average rate of 3.3 per 100,000. “In New York City, which is constantly (and mostly correctly) being held up as proof that urban safety miracles can happen in America, it’s 6.3,” Hertz writes. “The North Side is unbelievably safe, at least as far as murder goes.” Despite belonging to one of Chicago’s more violent districts, Hyde Park itself parallels the North Side, with an average murder rate of 3.6 per 100,000 for 2008–11. Looking at the data for individual police districts, though, Hertz found that the decline in murder rates has been anything but even. The gap between the haven of the North Side versus the West and South Sides—which give Chicago its reputation—has roughly tripled in the past two decades, says Hertz. “In the early ’90s, the most dangerous third of the city had about six times as many murders as the safest third,” he writes. “By the late 2000s, the most dangerous part of the city had nearly fifteen times more homicides than the safest third.” Seven districts have even seen an increase in homicides, including Chicago Lawn and Morgan Park, which saw 1990–93 averages of 9 and 17 deaths per 100,000, respectively, creep up to 13 and 17 deaths per 100,000 over 2008–11. Even though absolute murder rates have dropped across Chicago, the growing inequality of violence has its own set of consequences. “There are studies to prove that reputation has as much or bigger an effect on the economic development of a neighborhood than the actual crime rate,” Hertz says. “And reputations are based on relative status.”
Change in homicide rates
[[{"type":"media","view_mode":"media_original","fid":"1016","attributes":{"alt":"","class":"media-image","height":"520","typeof":"foaf:Image","width":"460"}}]]
Ratios of homicide rates to city averages
[[{"type":"media","view_mode":"media_original","fid":"1017","attributes":{"alt":"","class":"media-image","height":"520","typeof":"foaf:Image","width":"460"}}]] [[{"type":"media","view_mode":"media_original","fid":"1018","attributes":{"alt":"","class":"media-image","height":"520","typeof":"foaf:Image","width":"460"}}]]
Infographic
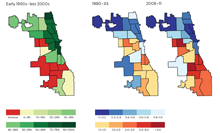
City of Chicago police district maps showing the change in homicide rates (left) and the ratios of homicide rates to city averages (right).